



























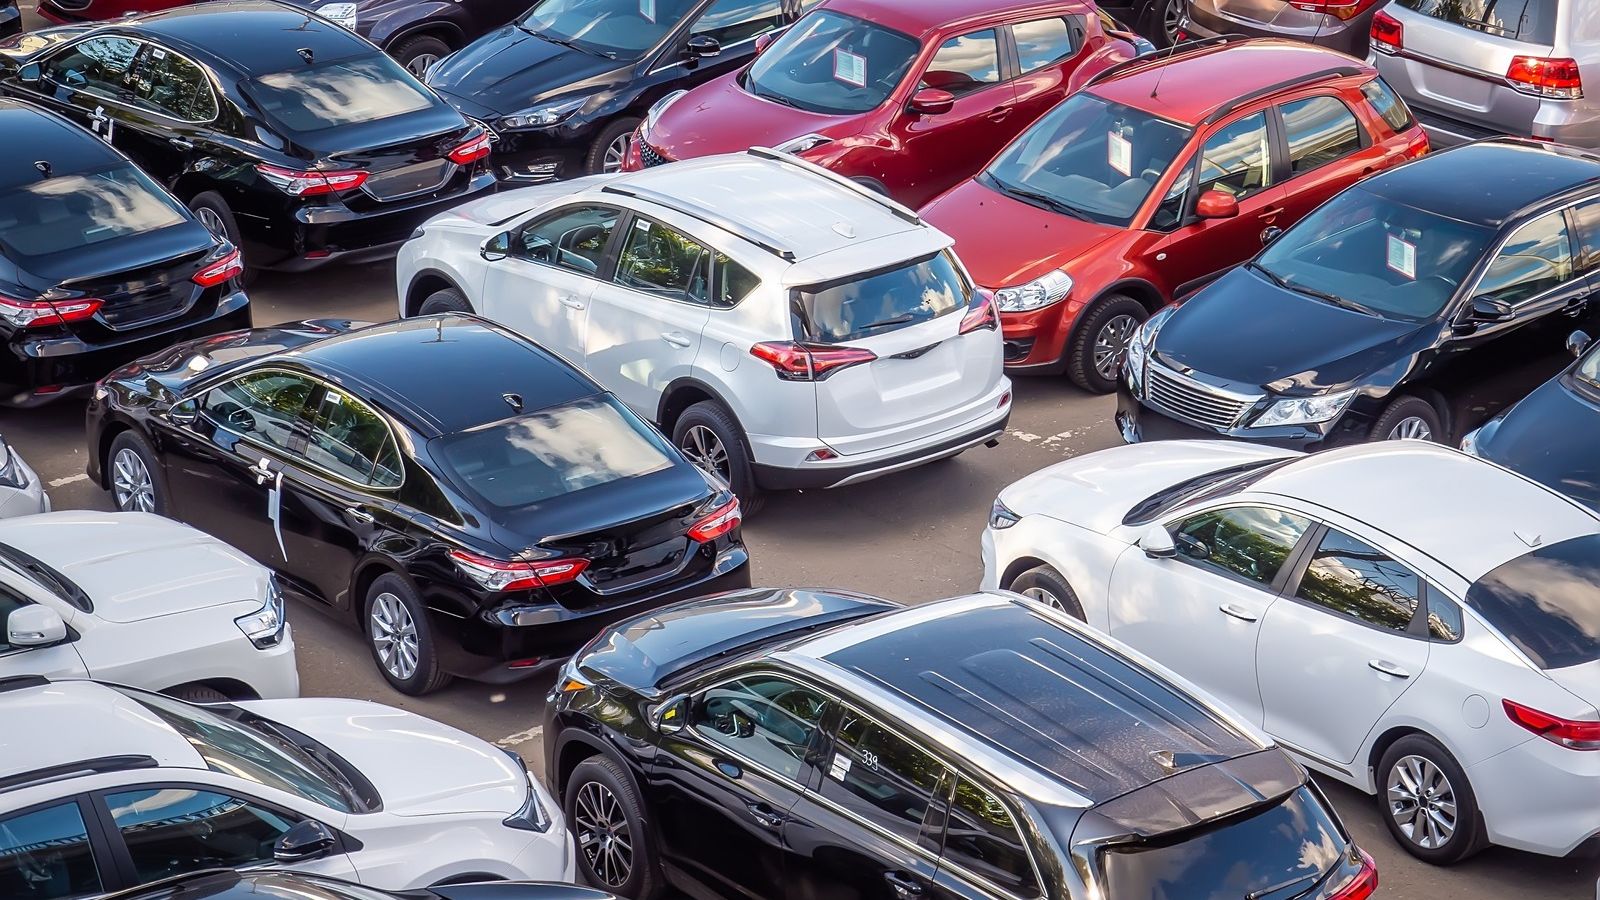
Canada’s stubbornly expensive used-car market has finally crossed an important line. After 16 consecutive months in which average prices remained above their year-earlier levels, August brought the first annual decline since March 2025. The change is modest on the surface, but the numbers underneath suggest something more meaningful is happening.
Vehicles are taking longer to sell, near-new models are becoming more plentiful, wholesale values continue to soften, and price declines are increasingly visible across provinces and vehicle categories. The shift does not mean Canadians are suddenly returning to pre-pandemic bargains. Used vehicles remain expensive by historical standards. But after years in which limited supply routinely worked against shoppers, the balance between buyers and sellers is beginning to look noticeably different.
The Streak Is Finally Over
The national average used vehicle sold for $33,752 in August 2026, according to Clutch’s latest Canadian pricing data. That was only 0.1% below July’s $33,786, so there was no dramatic month-to-month collapse. The more important comparison was with August 2025: the average was 0.5% lower. It marked the first time since March 2025 that the national average had fallen below its level from a year earlier. In between came 16 consecutive months of year-over-year increases, including a particularly sharp 7.9% annual gain in August 2025.
That makes the latest reading more significant than the 0.5% figure might initially suggest. It represents the end of a long period in which used vehicles kept resisting the kind of normalization many buyers had expected after pandemic-era shortages eased. Clutch’s dataset covers sold vehicles from model year 2016 or newer with fewer than 200,000 kilometres, so it does not represent every second-hand vehicle in Canada. Even so, the national sample shows that depreciation has finally become strong enough to overcome the forces that had been keeping average transaction prices elevated.
The Headline Drop Is Smaller Than the Real Shift
Looking only at the average price actually understates how much the market has softened. When Clutch compared the same vehicle model at the same age, rather than simply averaging everything Canadians purchased, comparable used vehicles were 2.2% cheaper than they had been in August 2025. That measure removes some of the distortions created when consumers buy a different mix of newer, older, larger or smaller vehicles from one year to another. A two-year-old model is effectively compared with the same model at the same age a year earlier.
The median transaction paints a similar picture. The vehicle sitting at the midpoint of August sales changed hands for $28,999, compared with $29,888 a year earlier. That works out to a decline of roughly 3%, or about $900. The gap between a 0.5% drop in the average and a 3% drop in the median matters because expensive vehicles can pull an average upward. For many households shopping closer to the middle and lower portions of the market, the price improvement has therefore been more noticeable than the national headline implies.
Newer and Larger Vehicles Hid the Decline
One reason it took until August for the national average to turn negative is that Canadians have been purchasing a more expensive mix of used vehicles. Throughout 2026, buyers shifted toward newer models and toward SUVs and other larger vehicles. Clutch calculated that this changing mix alone added between approximately $450 and $1,030 to the national average in monthly year-over-year comparisons. In other words, comparable vehicles were already depreciating, but consumers were increasingly choosing examples that naturally carried higher price tags.
That distinction helps explain why the market appeared unusually stable for much of the year. A dealership can sell more two-year-old SUVs instead of five-year-old sedans and report a higher average selling price even when the actual value of each individual model is declining. The effect was strong enough to conceal underlying depreciation for months. By August, however, falling like-for-like values finally outweighed that richer mix. It is an important reminder that average transaction prices are partly a measure of what vehicles consumers decide to buy, not simply what any particular used vehicle is worth.
Slower Sales Are Giving Buyers More Breathing Room
Last summer, desirable used vehicles often did not remain available for long. August and September 2025 were the fastest-selling months in Clutch’s records, with more than one-third of vehicles selling within two weeks of being listed. By August 2026, fewer than three in 10 vehicles were selling within that two-week window. Overall selling times had returned to roughly the levels recorded in August 2024, before the market tightened significantly the following year.
That change can have a direct effect on negotiations. A vehicle that attracts several buyers immediately gives a seller little reason to lower the price. One that remains unsold for several weeks creates carrying costs and raises the possibility that its asking price is too ambitious. The slowdown was not confined to luxury vehicles or one niche category. Clutch found that every price band below $70,000 experienced a broadly similar deterioration in selling speed, as did every major body style. For shoppers who grew accustomed to competing for vehicles during the shortage years, simply having more time to compare alternatives represents a meaningful change.
Near-New Vehicles Are Where Pressure Is Building
The supply picture is shifting most visibly among vehicles only a couple of years old. Models from the 2024 model year represented 16.8% of August 2026 used sales, up from 13.8% for the equivalent two-year-old cohort a year earlier. That jump effectively moved two-year-old vehicles from roughly one in seven transactions to about one in six. More near-new inventory gives buyers alternatives to paying full new-vehicle prices, but it also means dealers have more similar vehicles competing for the same customers.
The pricing difference is already visible. A two-year-old SUV sold for an average of $38,044 in August, compared with $41,092 for the equivalent age group a year earlier. Clutch also found that one- to three-year-old vehicles were 2.7% cheaper on a comparable-model basis, while four- to six-year-old vehicles fell 2.8%. Canadian Black Book has separately identified newer used vehicles as particularly exposed to depreciation after the unusually strong values accumulated during the pandemic period. The result is a market where lightly used vehicles may face more downward pressure than shoppers have seen in several years.
Wholesale Prices Are Sending the Same Signal
Retail transactions are not the only place where values are weakening. Canadian Black Book’s Used Vehicle Retention Index fell to 127.5 points in August from 127.9 in July. More significantly, the index was 7.6% below its level from a year earlier and had declined by approximately 4.5% since the beginning of 2026. The index tracks wholesale values for two- to six-year-old vehicles and adjusts for factors including age, mileage, condition and seasonality, making it a useful view of what is happening before many vehicles reach consumers.
The trend continued through September. Canadian Black Book reported that wholesale values fell another 0.14% during the week ending September 26. Car values declined 0.07%, while truck and SUV values fell 0.20%. The weekly move was not unusually severe—in fact, the overall decline was smaller than the 0.25% average recorded during the comparable pre-pandemic weeks from 2017 through 2019. That distinction is important. Wholesale data suggests continued depreciation, but so far the movement looks more like a market returning to normal seasonal behaviour than one experiencing a sudden collapse.
SUVs Still Dominate the Used Market
Canada’s preference for SUVs continues to shape national prices. SUVs accounted for 65% of used sales in August, the highest proportion in Clutch’s dataset. Passenger cars slipped to 20.7%, their lowest recorded share, while trucks represented the remaining 14.3%. Because an average SUV sells for roughly $8,350 more than an average car, the continuing shift toward utility vehicles mechanically pushes the overall used-vehicle average higher even when individual SUV values are falling.
Once vehicle mix is removed, however, depreciation looks remarkably consistent. Comparable cars were 2.1% cheaper than a year earlier, SUVs were down 2.3%, and trucks fell 2.2%. SUVs contributed the largest portion of the market’s dollar decline simply because they account for nearly two-thirds of sales. Regional SUV prices also softened broadly: six of seven major regions recorded year-over-year declines in average SUV selling prices. Manitoba showed a 5.7% drop and Alberta a 5% decrease. The enduring popularity of SUVs is therefore supporting the national average, but it is no longer preventing individual utility vehicles from depreciating.
Trucks Are Losing More Dollars Per Vehicle
Pickup trucks illustrate how a percentage decline can translate into a much larger dollar difference on expensive vehicles. The average used truck sold for $46,952 nationally in August, approximately $1,500 less than a year earlier. After controlling for age and model, Clutch estimated that roughly $1,100 of the difference came from the same truck simply being worth less. Comparable truck prices declined 2.2%, close to the changes seen among cars and SUVs, but the higher starting price makes depreciation more noticeable in dollar terms.
Regional truck pricing was uneven. British Columbia’s average fell 4.1% from a year earlier, while Ontario was down 4%. Alberta trucks declined 3.7%. The Ford F-150 provides a recognizable example of the broader trend. Its average selling price fell 4.1% year over year to $43,860, and a comparable F-150 of the same age cost about $1,000 less. Two-year-old examples were down even more sharply. The F-150 also slipped from first to third among Canada’s best-selling used vehicles in Clutch’s ranking, behind the Nissan Rogue and Honda CR-V.
Alberta Is Leading the Price Retreat
The national decline has been anything but evenly distributed. Alberta posted one of the sharpest provincial changes, with the average used selling price falling 3.5% from $37,969 in August 2025 to $36,621 in August 2026. Comparable same-model, same-age vehicles were down an even steeper 3.1%. Manitoba also weakened substantially, while British Columbia and Saskatchewan recorded smaller declines. The pattern matters because the national average can conceal very different conditions from one province to another.
Alberta’s contribution was particularly striking. After weighting price movements by each region’s share of national sales, Clutch estimated that Alberta alone reduced the Canadian average by $193. The total national average fell only $158 because increases elsewhere offset some of Alberta’s decline. Selling times also slowed more sharply in Alberta than in any other region studied, creating a plausible connection between weaker pricing and vehicles remaining on the market longer. For Alberta buyers, that combination can translate into more negotiating room, especially for vehicles that have already spent several weeks waiting for a buyer.
Quebec Shows Why Averages Can Mislead
At first glance, Quebec appeared to move in the opposite direction from the national market. Its average used-vehicle selling price climbed 1.9% from $29,550 to $30,097. That might suggest vehicles were becoming more expensive in the province while values fell elsewhere. A closer comparison tells a different story. When the same model was compared at the same age, Quebec prices were actually 1.7% lower than a year earlier. Consumers simply purchased a newer and more expensive mix of vehicles.
The difference demonstrates why headline averages need context. Quebec added an estimated $117 to the national average because its sales mix became richer, partially offsetting decreases in Alberta, British Columbia, Manitoba, Ontario and Saskatchewan. Yet underlying comparable prices were still falling. Quebec also remained one of the country’s more affordable regions in Clutch’s budget categories, with relatively high shares of cars, SUVs and trucks selling below commonly watched price thresholds. Rather than being immune to depreciation, Quebec shows how changing consumer choices can temporarily make a declining market appear stronger than it really is.
Ontario Is Quietly Getting Cheaper Too
Ontario produced perhaps the least dramatic headline movement of any major market. The average used vehicle sold for $33,783 in August, only 0.2% below the $33,841 recorded a year earlier. On the surface, that looks essentially flat. Once the vehicle mix is controlled, however, comparable models were 1.8% cheaper. The same phenomenon seen in Quebec was therefore present in Ontario as well, although without enough upward pressure from newer vehicles to push the overall average higher.
Ontario matters disproportionately because Clutch estimates that it represents about 38% of Canadian used sales. Even modest changes in the province can have a large influence on national statistics. Price declines were also visible within important Ontario categories. Average SUV transaction prices fell 1.4%, passenger cars declined 2.2%, and trucks dropped 4% from their year-earlier levels. For households around Toronto and other large Ontario markets, the shift may feel less dramatic than Alberta’s decline, but the direction is increasingly consistent: comparable vehicles are costing less even while the national market remains expensive by historical standards.
Relief Is Concentrated in the Affordable Half
The price decline has not benefited every buyer equally. The cheapest 10% of vehicles sold for 4.5% less than they did a year earlier, according to Clutch. Prices at the lower quarter of the market were down 2.3%, while the median declined 3%. Those are substantially larger decreases than the 0.5% movement in the overall average. At the 75th percentile, by contrast, prices were essentially unchanged at roughly $41,000, and the most expensive 10% of transactions actually increased by 1.1%.
That unusual split helps explain why different shoppers may have very different impressions of the market. Someone searching for a practical vehicle near the middle of the price distribution can now encounter real year-over-year savings. A household looking for a late-model luxury vehicle may notice much less change because wealthier buyers have continued shifting toward newer examples. The broader implication is encouraging for affordability, although only cautiously so. Years of pandemic-era price inflation are not being reversed overnight, but the first meaningful relief is appearing precisely in the part of the market where price-sensitive buyers need it most.
Budget Buyers Have More Real Options
Affordable inventory has not disappeared despite the high national average. In August, 22.4% of passenger cars sold for less than $15,000, while 21.2% of SUVs were below $20,000 and 18.2% of trucks changed hands for less than $30,000. Those thresholds still require significant household spending, but they demonstrate how much choice exists below the headline $33,752 average. The vehicles dominating those categories are also familiar mainstream models rather than obscure low-volume products.
Among cars selling below $15,000, the Hyundai Elantra led the category with an average price of $11,626 and accounted for 11% of sales in that price tier. The Kia Forte averaged $11,490, while the Chevrolet Cruze averaged $11,299. Among sub-$20,000 SUVs, the Ford Escape led at an average $14,275, followed by vehicles such as the Nissan Rogue and Hyundai Tucson. In the truck category, the Ram 1500 averaged $21,942 among examples below $30,000, while the Ford F-150 accounted for more than one-fifth of transactions in that budget tier.
Used EVs Are Bucking the Trend
Electric vehicles remain an important exception to the broader decline. On a comparable model-and-age basis, used EV prices were 1.2% higher than in August 2025, while gasoline-powered vehicles were 2.4% cheaper and hybrids were down 1.4%. The average used EV sold for $42,069. Clutch also found that EVs were the only fuel type selling faster than they had a year earlier, suggesting demand remained firm even as the wider used market slowed.
The composition of the EV market is nevertheless changing quickly. Tesla represented 22.5% of used EV sales, down from 32.2% a year earlier. The Model 3’s average transaction price fell 9.5% to $28,897, although comparable same-age Model 3 values were roughly flat, meaning much of the apparent drop came from differences in which examples changed hands. AutoTrader independently found that EV pricing was moving differently from the overall market during the second quarter of 2026. The divergence shows why treating every used powertrain as part of one uniform market can produce misleading conclusions.
The Broader Vehicle Market Is Cooling Too
Used vehicles are not weakening in isolation. AutoTrader’s second-quarter 2026 Price Index found that average used prices were 2.6% lower than a year earlier, while new vehicle prices declined 2.2%. Its data comes from hundreds of thousands of listings rather than the transaction dataset used by Clutch, so the absolute prices are different. AutoTrader reported a June average of roughly $36,690 for used vehicles, for example. The direction, however, is consistent across both sources: pricing pressure has eased.
Demand has softened as well. AutoTrader estimated that used-vehicle sales declined 2.5% year over year during the second quarter and were down about 1% for the first half of 2026. New-vehicle sales fell 1.3% during the quarter and 2.6% through the first six months. Affordability remains a major constraint despite declining prices. That is why a few percentage points of depreciation should not be mistaken for cheap vehicles suddenly returning. Canada is moving away from peak pricing conditions, but many household budgets are still confronting vehicle costs far above pre-pandemic norms.
This Looks Like Normalization, Not a Crash
The strongest conclusion from the August data is not that Canada’s used-car market is collapsing. It is that normal depreciation is reasserting itself after an extraordinary period. Canadian Black Book’s retention index remains under downward pressure, but recent weekly wholesale declines have generally been measured rather than chaotic. Its 0.14% market decline in the final full week of September was actually smaller than the 0.25% decline typically recorded during the same week from 2017 through 2019.
There are also several reasons the market could continue gradually softening. Near-new 2024 models now represent a larger share of sales, vehicles are taking longer to sell, and wholesale values remain under pressure. At the same time, SUVs remain popular, high-quality vehicles still attract demand, and affordable supply has not suddenly become abundant. Clutch’s own outlook emphasizes watching whether the 2.2% like-for-like decline widens and whether two-year-old inventory continues growing. For Canadians who endured years of rapidly rising used prices, the biggest change may simply be that time and depreciation are finally beginning to work in the buyer’s favour again.