
























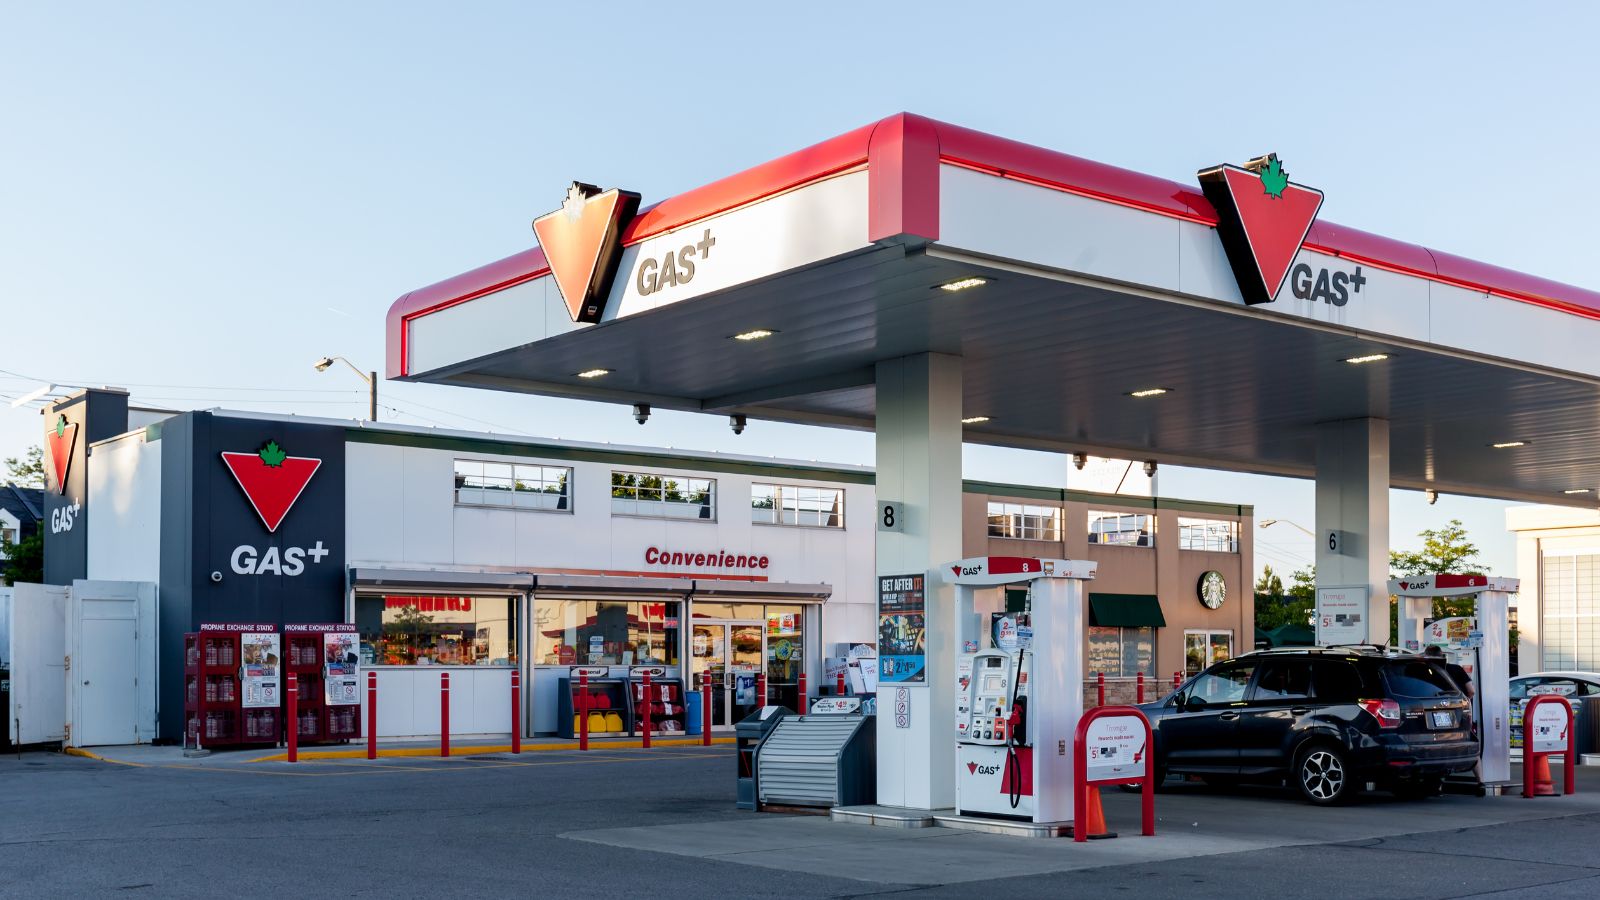
Canadian gasoline stations took in more money in August even as the inflation-adjusted volume of what they sold declined, highlighting how the amount spent at the pump can tell a different story from actual consumption. Statistics Canada reported that sales at gasoline stations and fuel vendors increased 1.7% from July, reaching roughly $7.42 billion on a seasonally adjusted basis. Yet when the effects of changing prices are removed, sales volumes fell 0.5%.
The divergence comes as fuel remains considerably more expensive than it was a year ago and offers an important window into household spending pressures. At the same time, the broader retail economy rebounded strongly in August, with sales increasing across all nine major subsectors.
Canadians Spent More Money but Bought Less Fuel in Real Terms
Sales at gasoline stations and fuel vendors climbed from approximately $7.30 billion in July to $7.42 billion in August, an increase of about $121 million. That represented a 1.7% monthly increase and the first rise in current-dollar sales for the category in three months. Compared with August 2025, current-dollar sales were 22.6% higher, making fuel one of the most striking year-over-year increases in Statistics Canada’s retail tables.
The volume figure tells a different story. After Statistics Canada adjusted sales for price changes, gasoline-station and fuel-vendor activity fell 0.5% in August. In practical terms, higher cash-register revenue does not necessarily mean Canadians drove more kilometres or bought more fuel. A household can spend more over a period even while purchasing fewer litres when the broader price environment remains elevated. Statistics Canada calculates retail sales volumes by deflating current-dollar sales using consumer price indexes, making the volume measure particularly useful for separating spending growth from price effects.
Gasoline Was Still Far More Expensive Than a Year Earlier
The broader price picture helps explain why nominal fuel spending needs to be interpreted carefully. Statistics Canada’s Consumer Price Index showed gasoline prices were 22.8% higher in August 2026 than they had been in August 2025. That was slightly less severe than July’s 25.7% annual increase, but it still meant motorists were operating in a dramatically more expensive fuel environment than one year earlier. Overall consumer prices were up 3.0% over the same 12-month period.
Month-to-month pricing was more nuanced. Statistics Canada’s national average price for regular unleaded gasoline at self-service stations was 173.8 cents per litre in August, compared with 175.5 cents in July. That means the 1.7% increase in seasonally adjusted sales at gasoline stations should not simply be interpreted as a direct result of regular gasoline becoming more expensive from one month to the next. Retail-trade data and average pump-price statistics differ in their scope and adjustments. The important takeaway is that fuel-related dollar spending strengthened while inflation-adjusted sales volume softened.
The Rest of Canada’s Retail Economy Rebounded
Fuel was only one piece of a much stronger August for Canadian retailers. Total retail sales increased 1.2% from July to $74.57 billion, reversing much of the weakness seen a month earlier. Every one of the nine major retail subsectors recorded higher current-dollar sales, a broad improvement compared with July, when sales had declined in eight of nine subsectors.
The rebound was not purely a price story. Total Canadian retail sales measured in 2017 chained dollars, Statistics Canada’s volume measure, also increased 1.2% in August. Compared with August 2025, current-dollar retail sales were 5.4% higher, while inflation-adjusted volumes were up a more modest 1.8%. The gap between those figures illustrates why nominal spending alone can sometimes exaggerate the strength of consumer demand. Canadians were clearly spending more money than a year earlier, but the quantity of goods represented by that spending increased at a considerably slower pace. August nevertheless marked a meaningful improvement from July, when total sales volumes had fallen 1.1%.
Vehicle Dealers Were a Major Driver of the August Recovery
Motor vehicle and parts dealers played an outsized role in the rebound. Sales in the category increased 1.2% to nearly $19.96 billion in August, and Statistics Canada identified the subsector as the largest contributor to the overall increase. New-car dealers were particularly important, with sales rising 1.5% from July to roughly $15.78 billion. That followed a 1.4% decline in new-car sales during July.
Not every part of the automotive market moved higher. Used-car dealer sales slipped 0.5% to about $1.63 billion, while other motor vehicle dealers posted a 1.4% decline. Automotive parts, accessories and tire retailers moved in the opposite direction, recording a 1.4% increase to approximately $1.39 billion. The mixed results show why headline auto spending can conceal substantially different conditions within the sector. New vehicles accounted for most of the roughly $20 billion spent through motor vehicle and parts dealers, giving movements at new-car dealerships enough weight to influence the national retail number meaningfully.
Core Spending Strengthened Beyond Cars and Gasoline
Removing two of the most volatile components—motor vehicles and gasoline—still left Canadian retail spending higher in August. Core retail sales increased 1.1% to approximately $47.19 billion after falling 0.7% in July. That measure was also 4.2% higher than in August 2025, suggesting the month’s improvement extended beyond filling stations and vehicle showrooms.
Food and beverage retailers recorded a 1.1% increase to $13.37 billion, their first monthly gain in three months. Supermarkets and other grocery retailers accounted for roughly $9.53 billion of that total and also posted a 1.1% increase. General merchandise retailers rose 1.0% to about $11.09 billion after declining the previous month. Health and personal care retailers were another standout, increasing 1.6% to $6.80 billion. Statistics Canada said that category had now posted higher sales for 10 consecutive months, while its sales were 13.1% above their August 2025 level. Together, those figures point to a recovery spread across several everyday spending categories.
Ontario and British Columbia Led the Provincial Gains
The national rebound was not evenly distributed. Retail sales increased in six provinces during August, with Ontario producing the largest gain in dollar terms. Sales in Canada’s most populous province rose 2.2% to approximately $28.5 billion, led by motor vehicle and parts dealers. Toronto recorded an even stronger 4.0% monthly increase, a sharp turnaround after retail sales in the metropolitan area had fallen 4.7% in July.
British Columbia also recorded a significant recovery. Provincial retail sales increased 2.1% to roughly $10.0 billion, with motor vehicle and parts dealers again contributing to the gain. Vancouver’s sales increased by the same 2.1% rate. Alberta stood out in the opposite direction, with retail sales edging down 0.1% to about $9.6 billion as weaker motor vehicle and parts sales weighed on the province. The contrast is notable because Alberta had been one of the stronger provinces in July, when its retail sales increased 1.4% while Ontario and British Columbia both declined.
Online Retail Spending Continued to Expand
Digital spending also moved higher in August. Seasonally adjusted retail e-commerce sales increased 1.1% from July to approximately $5.65 billion. Online sales accounted for 7.6% of total Canadian retail trade, slightly above July’s 7.5% share. More strikingly, e-commerce sales were 15.3% higher than in August 2025, considerably faster than the 5.4% year-over-year increase recorded for overall current-dollar retail sales.
The e-commerce figure does not capture every transaction Canadians make online. Statistics Canada notes that several common digital purchases—including travel and accommodation bookings, ticket purchases and financial transactions—are outside the retail-sales measure. The $5.65 billion figure therefore reflects online activity within the retail sector rather than the entire digital economy. Even with that limitation, the annual growth rate shows online purchasing continued to expand rapidly. For retailers balancing physical locations, delivery operations and online storefronts, the data suggest e-commerce remains an increasingly important sales channel even as Canadians continue to spend the overwhelming majority of measured retail dollars through the broader retail system.
September Data Will Show Whether the Momentum Lasted
Statistics Canada’s early estimate suggests retail sales increased another 0.7% in September, which would extend the August rebound. That number should be treated cautiously, however. The advance calculation was based on responses from 58.5% of the companies surveyed, compared with an average final response rate of 86.8% during the previous 12 months. Statistics Canada explicitly describes the advance figure as unofficial and subject to revision as more information becomes available.
There is already a useful example of how that process works. A month earlier, Statistics Canada’s advance estimate suggested August retail sales would rise 1.3%. The completed August estimate released in October placed the increase at 1.2%, only one-tenth of a percentage point lower but enough to demonstrate that early figures can change. Fuel will remain particularly important to watch. September CPI data showed gasoline prices were 27.8% higher than a year earlier, accelerating from August’s 22.8% increase. Final September retail-trade figures are scheduled for release on November 20, 2026.